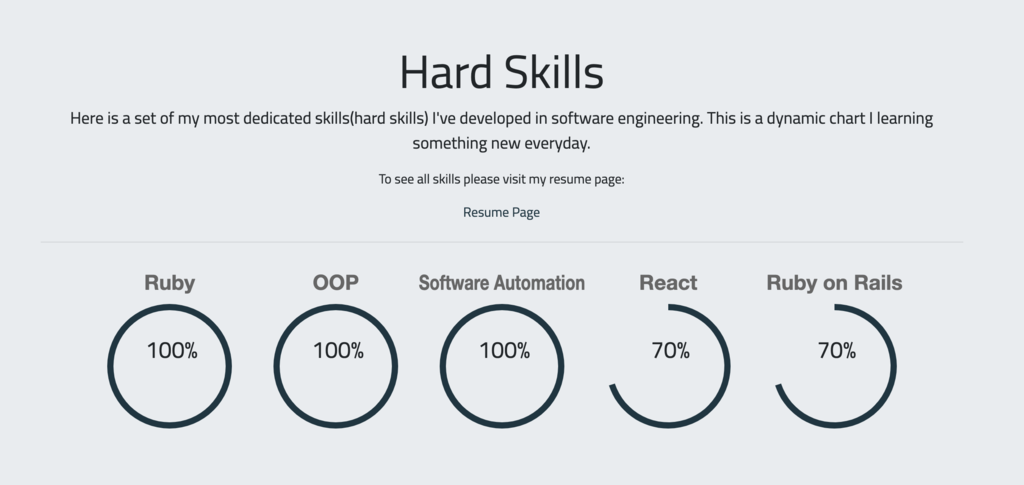
You probably have seen these skills doughnut skill charts on portfolio websites before. I would like to share how I implemented it using React, Webpack, ChartJS2 for react and Rails.
demo(Hard skills) github Screen Shot 2019-07-08 at 3.21.10 PM.png183 KBWhat you need to have ready:
Assuming you got everything mention above working and ready to go, first we need to create a new javascript pack reference on the view page where we want to render our React component. In my case it's home page and my react app name is 'Home'. Also I use a mix of sporkets and webpack so i will be also needed to add styling tag(you can use any style packers you found best suiting your needs) and the last thing on this page is actual div element where React will render Component itself:
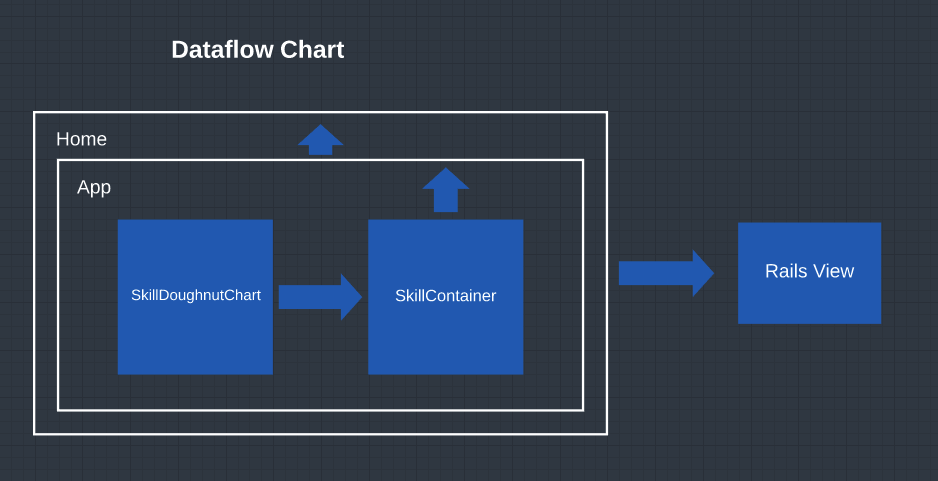
Before going forward I want to show my React Dataflow Chart that you can have an idea how all Components connected:
React Dataflow Chart
Next we need to create actual Home Component with render method inside. I have standard file structure as WebPack suggested for its react components - app/javascript/Home.jsx :
import React from 'react';
import ReactDOM from 'react-dom';
import App from './home/App'

document.addEventListener('DOMContentLoaded', () => {
  ReactDOM.render(
      <App name="React" />, document.getElementById('reactHome'))
});
Next the App Component which gather all Components together . I am using lazy loading in this case you can you regular import file statements:
Next we passing data and props from our SkillsContainer. I use simple axious get ajax call to retrieve data from my api. Also I use Bootstrap classes for styling. Also I use es6 javascript arrow functions. Worth to mention that you can't render extra labels like percentage at the meddle of canvas, so I use simple div to render text and use some css twiks to move it up:
import React from 'react';
import ReactDOM from 'react-dom';
import axios from 'axios/index';
import ChartSkills from './ChartSkills'

class SkillsContainer extends React.Component {

  constructor(props){
    super(props);

    this.state = {
      loadingHard: true,
      hard_skills: null,
      soft_skills: null,
      chartData:{}
    };
  }

  componentDidMount() {
    axios.get('/hard-skills')
        .then( res => {
          this.setState({hard_skills: res.data, loadingHard:false});
        })
        .catch( err => {
          console.log(err)
        });
  }

  render() {
    if (!this.state.loadingHard) {
      return (
          <div className="jumbotron jumbotron-fluid m-0">
            <div className="container text-center">
              <h1 className="display-4">Hard Skills</h1>
              <p className="lead">Here is a set of my most dedicated skills(hard skills) I've developed in software engineering. This is a dynamic chart I learning something new everyday.</p>
              <p>To see all skills please visit my resume page: </p><a href="/resume">Resume Page</a>
              <hr className="my-4"/>
              <DrawHardSkills skills={this.state.hard_skills}/>
            </div>
          </div>
      );
    }
    else {
      return (
          <div>
            Loading...
          </div>
      );
    }
  }
}

const DrawHardSkills = (props) => {
  return(
      <div className="skillsWrapper">
        {props.skills.map(skill => (
            <div className="chartItem" key={skill.id}>
              <ChartSkills
                  chartData={
                    {
                      labels: [skill.name],
                      datasets: [{
                        label: '# of Votes',
                        data: [skill.percent, (100-skill.percent)],
                        backgroundColor: [
                          'rgba(25,54,65)',
                          'rgba(255, 255, 255, 0)'],
                        borderColor: [
                          'rgba(25,54,65)',
                          'rgba(255, 99, 132, 1)'],
                        borderWidth: 0}]
                    }
                  }
                  displayLegend={false}
                  chartName={skill.name}
              />
              <h3 className="floatedPercent">{skill.percent}%</h3>
            </div>
        ))
        }
      </div>
  )
};


export default SkillsContainer
Here is the css for that div text percentage label:
That's pretty much it you can modify SkillDoughnutChart class the way you want and reuse it as many times as needed. You also can change the chart type or mix them together